您现在的位置是:网站首页> 编程资料编程资料
Prometheus 监控MySQL使用grafana展示_Mysql_
![]() 2023-05-26
367人已围观
2023-05-26
367人已围观
简介 Prometheus 监控MySQL使用grafana展示_Mysql_
prometheus通过exporter监控mysql,并用grafana图表展示
概述:
prometheus是由SoundCloud开发的开源监控告警系统并且自带时序数据库,基于Go语言。Prometheus根据配置的任务(job)以周期性pull的方式获取指定目标(target)上的指标(metric)。
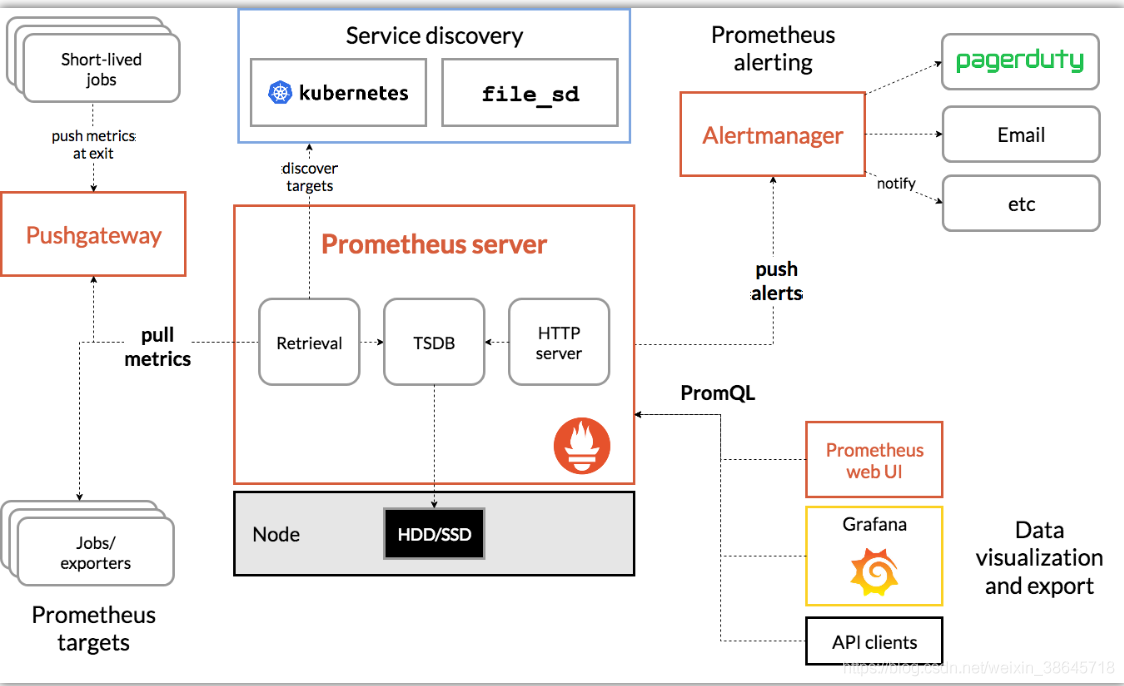
Prometheus 生态圈中包含了多个组件:
- Prometheus Server: 根据配置完成数据采集, 服务发现以及数据存储。
- Push Gateway : 为应对部分push场景提供的插件,监控数据先推送到 Push Gateway 上,然后再由 Prometheus Server 端采集 pull 。用于存在时间较短,可能在 Prometheus 来 pull 之前就消失了的 jobs (若 Prometheus Server 采集间隔期间,Push Gateway 上的数据没有变化, Prometheus Server 将采集到2次相同的数据,仅时间戳不同)
- Exporters(探针): 是Prometheus的一类数据采集组件的总称。它负责从目标处搜集数据,并将其转化为Prometheus支持的格式。与传统的数据采集组件不同的是,它并不向中央服务器发送数据,而是等待中央服务器主动前来抓取。
- Alertmanager: Prometheus server 主要负责根据基于PromQL的告警规则分析数据,如果满足PromQL定义的规则,则会产生一条告警,并发送告警信息到Alertmanager,Alertmanager则是根据配置处理告警信息并发送。常见的接收方式有:电子邮件,webhook 等。Alertmanager三种处理告警信息的方式:分组,抑制,静默。
接下来开始演示
1、测试机器
prometheus-server 192.168.56.140 MySQL host01 192.168.56.103 MySQL host02 192.168.56.104
2、配置mysql host01
MySQL使用版本:
8.0.25 MySQL Community Server
3、创建exporter帐号
mysqld_exporter通过查询mysql的状态表及状态命令获取数据。所以,需要先在mysql内,创建相应帐号
create user 'exporter'@'%' identified by 'Xiaopang*803'; GRANT REPLICATION CLIENT, PROCESS ON *.* TO 'exporter'@'%'; GRANT SELECT ON performance_schema.* TO 'exporter'@'%'; flush privileges;
4、下载,安装mysqld_exporter
wget https://github.com/prometheus/mysqld_exporter/releases/download/v0.13.0/mysqld_exporter-0.13.0.linux-amd64.tar.gz
tar xvzf mysqld_exporter-0.13.0.linux-amd64.tar.gz -C /usr/local/.
cd /usr/local && ln -s mysqld_exporter-0.13.0.linux-amd64/ mysqld_exporter
4.1 编辑文件输入密码
编缉如下文件,输入exporter用户句与密码(与前面mysql内创建的帐号密码一致)
[root@host01 mysqld_exporter]# vi .my.cnf [client] user=exporter password=Xiaopang*803
4.2 添加启动服务文件
[root@host01 ~]# vi /etc/systemd/system/mysqld_exporter.service
[Unit] Description=mysqld_exporter After=network.target [Service] Type=simple ExecStart=/usr/local/mysqld_exporter/mysqld_exporter --config.my-cnf=/usr/local/mysqld_exporter/.my.cnf Restart=on-failure [Install] WantedBy=multi-user.target
4.3 启动mysqld_exporter
service mysqld_exporter start
4.4 测试验证
mysqld_exporter默认使用9104端口,我们可以在浏览器内输入如下地址。查看是否有数据输出。
输入 http://192.168.56.103:9104/metrics
输出信息类似如下:
# HELP go_gc_duration_seconds A summary of the pause duration of garbage collection cycles. # TYPE go_gc_duration_seconds summary go_gc_duration_seconds{quantile="0"} 2.5395e-05 go_gc_duration_seconds{quantile="0.25"} 3.5372e-05 go_gc_duration_seconds{quantile="0.5"} 3.9393e-05 go_gc_duration_seconds{quantile="0.75"} 5.5068e-05 go_gc_duration_seconds{quantile="1"} 0.062537624 go_gc_duration_seconds_sum 0.453204071 go_gc_duration_seconds_count 2131 # HELP go_goroutines Number of goroutines that currently exist. # TYPE go_goroutines gauge5、下载,安装node_exporter
如果只安装mysqld_exporter则无法监控OS相关的数据,所以需要安装node_exporter进行OS监控。
wget https://github.com/prometheus/node_exporter/releases/download/v1.2.2/node_exporter-1.2.2.linux-amd64.tar.gz tar xvzf node_exporter-1.2.2.linux-amd64.tar.gz -C /usr/local/. cd /usr/local && ln -s node_exporter-1.2.2.linux-amd64/ node_exporter
5.1 添加启动服务文件
[root@host01 ~]# vi /etc/systemd/system/node_exporter.service [Unit] Description=node_export Documentation=https://github.com/prometheus/node_exporter After=network.target [Service] Type=simple User=root Group=root ExecStart=/usr/local/node_exporter/node_exporter Restart=on-failure [Install] WantedBy=multi-user.target
5.2 启动node_exporter
service node_exporter start
5.3 测试验证
node_exporter默认使用9100端口,我们可以在浏览器内输入如下地址。查看是否有数据输出。
输入 http://192.168.56.103:9100/metrics
输出结果类似如下:
# HELP go_gc_duration_seconds A summary of the pause duration of garbage collection cycles. # TYPE go_gc_duration_seconds summary go_gc_duration_seconds{quantile="0"} 2.5934e-05 go_gc_duration_seconds{quantile="0.25"} 4.0072e-05 go_gc_duration_seconds{quantile="0.5"} 4.7616e-05 go_gc_duration_seconds{quantile="0.75"} 6.726e-05 go_gc_duration_seconds{quantile="1"} 0.228887598 go_gc_duration_seconds_sum 0.550266258 go_gc_duration_seconds_count 793 # HELP go_goroutines Number of goroutines that currently exist. # TYPE go_goroutines gauge6、安装prometheus+grafana
使用版本:
prometheus 2.28
grafana 6.7.6
6.1 安装
下载软件包
wget https://github.com/prometheus/prometheus/releases/download/v2.28.1/prometheus-2.28.1.linux-amd64.tar.gz
6.2 解压并添加软链接
tar xvzf prometheus-2.28.1.linux-amd64.tar.gz -C /usr/local/. cd /usr/local/ ln -s prometheus-2.28.1.linux-amd64/ prometheus
6.3 增加启动服务
[root@prometheus-server prometheus]# vi /etc/systemd/system/prometheus.service [Unit] Description=Prometheus Monitoring System Documentation=Prometheus Monitoring System [Service] Type=simple User=root Group=root ExecStart=/usr/local/prometheus/prometheus \ --config.file=/usr/local/prometheus/prometheus.yml \ --storage.tsdb.path="data/" \ --storage.tsdb.retention.time=15d \ --web.max-connections=512 \ --web.listen-address=:9090
6.4 添加mysql监控
vi /usr/local/prometheus/prometheus.yml
scrape_configs: # The job name is added as a label `job=` to any timeseries scraped from this config. - job_name: 'mysql' static_configs: - targets: ['192.168.56.103:9104'] labels: instance: mysql_instance1 - job_name: 'linux' static_configs: - targets: ['192.168.56.103:9100'] labels: instance: mysql_instance1
6.5 启动prometheus
service prometheus start
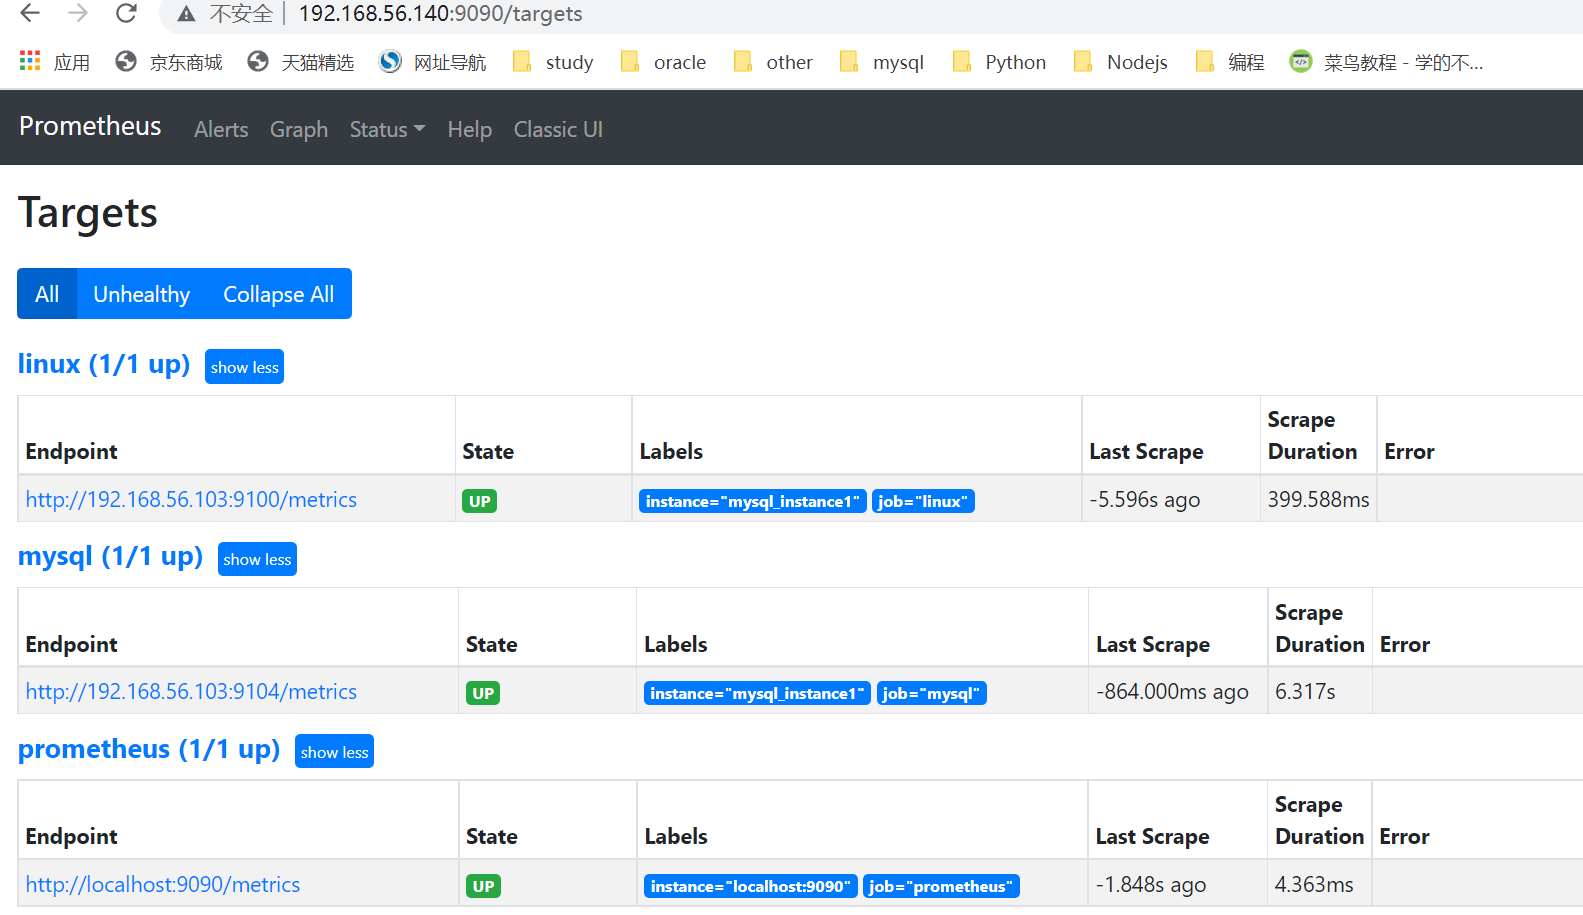
6.7 查看prometheus
prometheus默认监控端口
http://192.168.56.140:9090/
点击status->target。如果一切正常,可以看到如下mysql/linux的state为UP
7、下载,安装grafana
wget https://dl.grafana.com/oss/release/grafana-6.7.6-1.x86_64.rpm
rpm -ivh grafana-6.7.6-1.x86_64.rpm
7.1 访问grafana
prometheus的展示功能很弱,为了更好的进行图形展示,所以我们需要grafana
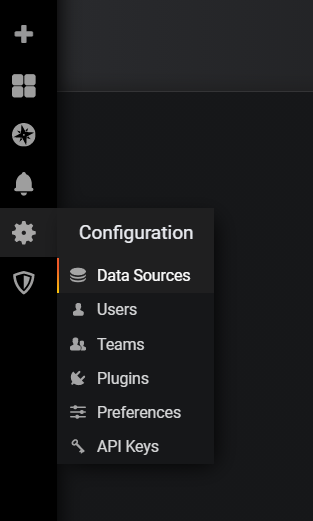
输入 http://192.168.56.140:3000/
配置data source为proemtheus的HTTP链接(注意是HTTP,而不是HTTPS)
提示:
本文由神整理自网络,如有侵权请联系本站删除!
本站声明:
1、本站所有资源均来源于互联网,不保证100%完整、不提供任何技术支持;
2、本站所发布的文章以及附件仅限用于学习和研究目的;不得将用于商业或者非法用途;否则由此产生的法律后果,本站概不负责!